
To assess the variations in nsSNPs among major geographically structured populations, we utilized Wright's F-statistics to estimate autosomal genome-wide fixation index (FST)1 at both the SNP and gene levels.
Wright's F-statistics, introduced by Sewall Wright in 19512, are fundamental tools in population genetics used to quantify genetic variation within and among populations. These statistics, comprising FIS, FST, and FIT, provide insights into the genetic structure and evolutionary dynamics of populations. FIS, the inbreeding coefficient, measures the deviation from random mating within subpopulations, reflecting the impact of inbreeding on genetic diversity. FST, the fixation index, quantifies genetic differentiation among subpopulations, indicating the extent of allele frequency divergence due to genetic drift or selection. FIT, the inbreeding coefficient relative to the total population, assesses the overall genetic variability reduction within individuals. Collectively, these metrics elucidate the interplay of evolutionary forces such as mutation, migration, selection, and drift, offering a comprehensive framework for understanding the genetic landscape and evolutionary processes shaping populations.
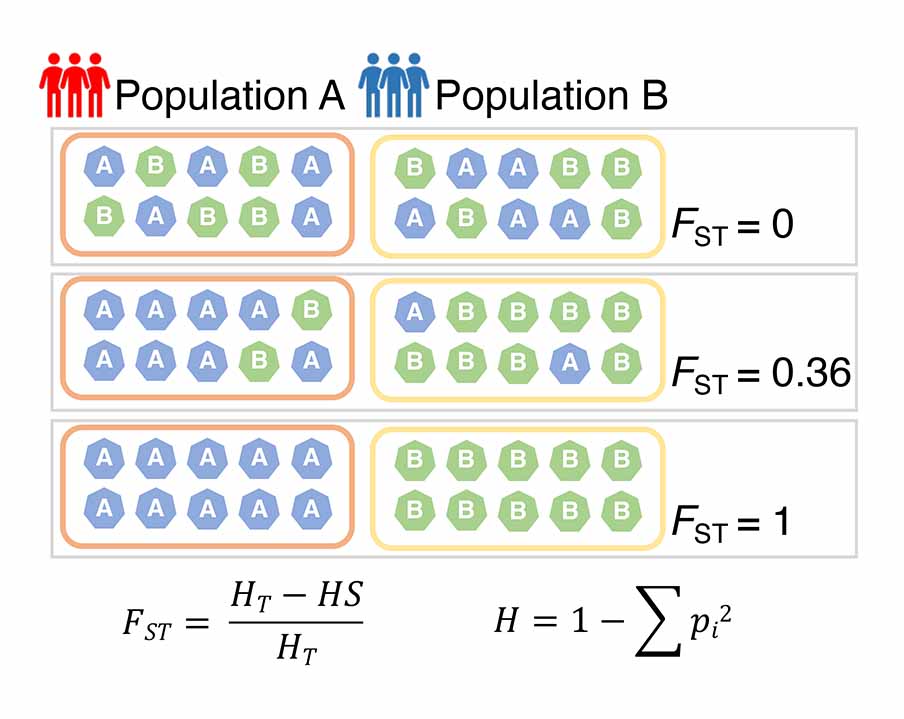
Diagram illustrating the approach that estimates FST value. The FST statistic quantifies genetic differentiation between subpopulations within a larger metapopulation, measuring the proportion of genetic variation attributed to differences between subpopulations. Higher FST values indicate greater genetic differentiation and limited gene flow between subpopulations. The FST value is calculated by comparing the average heterozygosity within a subpopulation (Hs) to the average heterozygosity within the metapopulation (Ht).
In this study, genetic differentiation for both autosomal protein-coding genes and nsSNP loci was measured using one of Wright's F statistics, the fixation index Fst1,2. The FST value quantifies the proportion of genetic variance based on allele frequencies3 and is calculated as follows:
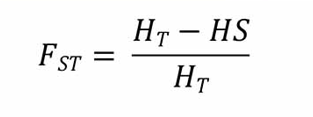
where HT represents the variation between populations and HS represents the variation within populations.
By comparing the average heterozygosity within a subpopulation to the average heterozygosity within the metapopulation, we could estimate the genetic differentiation within and among populations. The R package 'popgenome'4 was used to estimate both global FST and pairwise FST values between subpopulations. VCF files from the 1000 Genomes Phase 3 for 22 autosomes were used as input. The genome-wide data were then split into genes based on genomic positions using the 'splitting.data()' function. Global FST was calculated using the 'F_ST.stats()' function in the mode of "nucleotide". Pairwise FST values were extracted using 'nuc.F_ST.pairwise'. Site-specific FST values were obtained by setting 'subsites = nonsyn, site.FST=True'.
References:
1. Holsinger, K.E. & Weir, B.S. Genetics in geographically structured populations: defining, estimating and interpreting F(ST). Nat Rev Genet 10, 639-650 (2009).
2. Wright, S. The genetical structure of populations. Ann Eugen 15, 323-354 (1951).
3. Hudson, R.R., Slatkin, M. & Maddison, W.P. Estimation of levels of gene flow from DNA sequence data. Genetics 132, 583-589 (1992).
4. Pfeifer, B., Wittelsburger, U., Ramos-Onsins, S.E. & Lercher, M.J. PopGenome: an efficient Swiss army knife for population genomic analyses in R. Mol Biol Evol 31, 1929-1936 (2014).